Structural Dynamics
Thursday, 1 April 2010
Over the past few years, live tournament structures have definitely got better. However, it’s not always obvious what the benefits are.
Some of the smaller local card rooms definitely peddle a “bigger is better” attitude when it comes to starting stacks, but as the following analysis will show, it’s a bit more complex than that. There are three factors to bear in mind which govern the structure of a tournament:
1.Starting stack
2.Blind structure
3.Clock
Let’s have a look at these in more detail.
First, starting stack. This is the number of chips you get at the beginning, or get in total if it’s a double or triple chance. For rebuy tournaments, you should (a) try to get some information about the average number of rebuys in the past for this tournament, and (b) bear in mind how much a rebuy and/or add on stack is worth in terms of tournament M at the end of the rebuy period (if a rebuy only buys you, say, only 12 tournament Ms at that point, it might not be worth rebuying unless you’re at a total fishpond of a table).
Second, blind structure. Starting stack is all very well, but if the first level is 50-100 not 25-50 (as it is in the WSOP ME), that makes a difference too. The easiest way for casinos to disguise a bad structure is to miss out a few levels here and there, because that’s the last thing that people look for. Thankfully, almost all casinos (live and online) publish their blind structures – either on a flyer or on their website. Use the calculation below to give you a rough idea of how good the structure is.
Another good tip is to keep general tabs on tournaments if you happen to be in the casino playing cash games. You’re looking for the M of the average stack at various points: with half the field left, on the bubble, at the final table, and so on. This is the definitive indicator the strength of a tournament structure. If the M of the average stack is desperate when only half the field has dropped out, you know that the structure is not great and you’re going to need a lot of luck to make the big money.
Third, the clock, or in long hand, how long each blind level lasts. This is actually the biggest governing factor, in that even tournaments with great starting stacks and blind structures turn into crapshoots if the clock is too short. In general, anything above 60-minute blinds live and 20-minute blinds online give a very good tournament structure. Even 45-minute clocks live can be great given the correct blind structure and starting stacks.
It’s the combination of all these factors which determines the tournament structure, and a quick glance may not help elucidate here (although if you want a quick rule of thumb, I’d say that anything with a clock of 25 minutes or less live will be quite crapshooty near the bubble).
At one end of the extreme is the best structure available – the WSOP Main event. Granted, they cheekily miss out the 25-50 level, but you start with 30,000 chips and the clock is a staggering two hours per level. At the other end of the spectrum, most casinos and poker tours have now worked out that the punter is sensitive most of all to starting stack size. The success of the Deepstack Extravaganza of the Venetian in Vegas is testament to that. However, short clocks can mean that, in many of the festivals, the average M is around the 7-8 mark a long way before the bubble and virtually everyone is playing push/fold poker if not pre-flop, then on the flop.
Keep an eye out also for missing levels. A really well structured tournament (and you can look at the WSOP ME for a yardstick here) is one where the blind levels always increment smoothly – with the possible exception of the first few rounds when everyone is very deep. For example, it’s a killer when the antes come in and the blinds go up simultaneously, especially if this is quite late in the tournament. This tends to have the effect of halving the average M, and what was a decent structure (say, where the average M was around 16) becomes another push/fold fest (with an average M of 8) in the blink of an eye.
How does this translate into analysis of real tournaments? Well, as with most things in poker, some cold, detached, mathematical analysis usually does the trick. For example, the sudden jumps mentioned above will show up as such on a graph. Obviously, you can’t always do a detailed analysis such as the one below – especially in the casino, but for a guideline, just peruse through the blind structure and look for significant jumps in the blinds. If, on later levels, there are any jumps such that the total for blinds and antes goes up 50% or more in one fell swoop, these are likely to be fatal blows for the tournament structure, from which the entire field is unlikely to recover until deep into the final table.
As an aside, you should be aware of these jumps when you’re playing the tournament – some players will react to the changes and some won’t; some players will change their play in anticipation of these changes and some won’t; a good player will capitalise on these opponent tendencies.
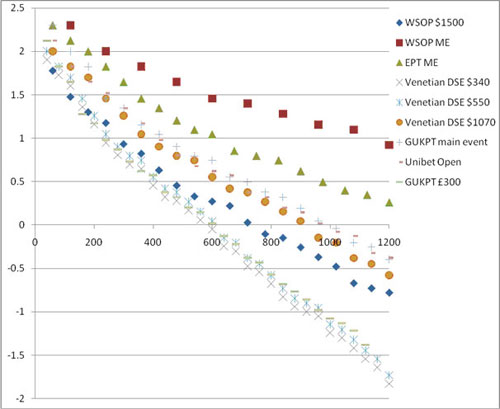
By turning the calculations into a visual picture, it becomes a lot more obvious what’s going on. Below, I’ve taken each tournament’s starting stack and divided it by the total for the blinds and antes at a certain point. I’ve assumed an average of nine players per table. Each calculation will give you a figure for a certain number of minutes into the tournament. It’s important to recognise that this figure is only relative – it’s not a measure of what your M will be at that moment, because, of course, as the tournament progresses, people bust out or increase their chip stack, and the average stack size increases. To simulate how the average M increases is very difficult and involves speculation. By sticking to the method of simply dividing the starting stack by the total of blinds and antes at time x, we have a universal figure for all tournaments at all times.
One more note (for those mathmos out there). The graph below is actually the log (base 10) of the quotient calculated (starting stack divided by sum of blinds and antes) because the blinds get exponentially bigger as time goes on. As you can see, the log of the quotient graphed against time gives an approximately straight line, so this is basically what we’re aiming for. I’ve graphed this data for the following tournaments:
| Tournament | Buy in | Starting stack | Clock /min |
| WSOP $1500 | $1,500 | 4500 | 60 |
| WSOP ME | $10,000 | 30000 | 120 |
| EPT ME | €5,000 | 30000 | 60-75 |
| Venetian DSE | $340 | 12000 | 40 |
| Venetian DSE | $550 | 15000 | 40 |
| Venetian DSE | $1070 | 15000 | 60 |
| GUKPT ME | £1,000 | 15000 | 60 |
| Unibet Open | €1,500 | 10000 | 60 |
| GUKPT | £300 | 10000 | 40 |
What you’re left with is a graph which is – in the absence of figures about how many players are left in the tournament at any one time – a best guess as to how the average M of each tournament diminishes over time. I must say I’m fascinated to see what the “real” graph would look like. Presumably, there would be a big drop in the curve towards the bubble, followed by a corrective flattening after the bubble burst, as players bust out in an attempt to get higher up the money places. As I say, to see the real graph, one would need constant data of average M over time. Perhaps I’ll save that one for a future article.
As for the graph we’re left with, well call me a sad old mathmo git, but I still think it’s fascinating. Remember that you won’t be able to get much real data out of this graph, because it’s just measuring how quickly your starting stack would diminish in each tournament over time (the horizontal axis, in minutes). However, you can an idea of how average Ms in each tournament fare against each other, and as I say, that’s the best measure of a tournament’s structure.
In general, the higher the line is up the vertical axis, the better the structure. Also, the steepness of the line indicates how much damage the blinds start doing as the tournament progresses. It should come as little surprise that the WSOP ME and EPT ME score best on both those counts. In fact, as one would expect, there seems to be a rough correlation between the size of buy-in and how good the structure is.
There seems also to be some bunching as each tournament progresses. Regardless of buy in, starting stack, or blind structure, the tournaments with a 40-minute clock have all fared relatively badly in comparison to those with 60-minute clocks or higher, including even the WSOP $1,500 which starts off with a measly 4,500 chips. In fact, even though the four tournaments with a 60 minute clock (the Unibet Open, the WSOP $1500, the DSE $1070 and the GUKPT main event) all have wildly differing blind structures and starting stacks, they all end up pretty much in the same area of the graph.
We should also be looking for smoothness in the line – that represents an even structure and not too many nasty jumps in the blinds. Jumps tend to homogenise what everyone in the tournament is doing, because it becomes more obvious that the blinds have just changed drastically. The more wonky a graph is, the more you’ll have to keep an eye on the blinds to make sure you’re changing gears and more importantly, getting ready to do so. I think the WSOP $1,500 graph looks a bit erratic, and there seem to be a few blips here and there – for example on the GUKPT ME graph when the antes kick in (after 180 minutes), and around the 10-hour point of the EPT ME and the Venetian DSE $1070. If anything, these blips might benefit those who are on their toes, as they will be aware of the structure and how to capitalise on the changes. However, as mentioned, if it means the tournament just degenerates into a crapshoot at that point, that’s a bit of a turn off.
Most interesting is to compare the two cheaper Venetian DSE tournaments. The reason these two follow each other so closely is that they have the same clock (40 minutes) and the exact same blind structure. The only difference is that the $340 starts with 12,000 chips and the $550 starts with 15,000 chips. Although that might sound like a big deal, you can see on the graph that, come the middle section of the graph (about 6-7 hours in), even though they start off in the same general area as their more expensive counterparts, by level 8 or so, they’ve dropped considerably. By comparison the WSOP $1,500 outstrips them later on by virtue of its 60-minute clock, and despite its much smaller starting stack.
As with many things, the structuring of a tournament boils down to a battle between consumers and providers. The casinos want to attract as many customers as possible but get the tournament over quickly. The latter consideration here is all about costs - dealers, tables and tournament staff being the obvious ones, but don’t forget the real estate value of the casino floor itself. It’s worth noting that, during the WSOP, the Venetian Deepstack is so popular that it spills over onto the casino floor, encroaching on the slot machines and blackjack tables.
As for benefits, while it might be established that the punter is most sensitive to starting stack size (while, in fact, clock seems to be most important), those aren’t the only factors. In the case of the Venetian Deepstack, the attraction of staying in a five-star hotel in Vegas for around $110 per night is a huge boon. The Unibet Opens have such a party atmosphere that you almost want to bust out by Saturday night so you can go clubbing. And, of course, the cachet of the tournament is a major draw, as the thousands that go in search of that elusive bracelet each year can attest to.
So, in conclusion, don’t be fooled by big starting stacks. If the blind structure is bad, it’ll catch up with you pretty soon. The most important factor is probably the clock, and any tournament with a 60 minute clock or more is likely to have a great structure. To that end, by the way, the Venetian DSE $1,070 is a great value tournament. The best tips are to keep an eye on when the antes kick in and, when comparing tournaments, watch out for “missing levels” later on. As a general rule, the more you pay for a tournament, the better its structure will be, but it pays to read the small print.